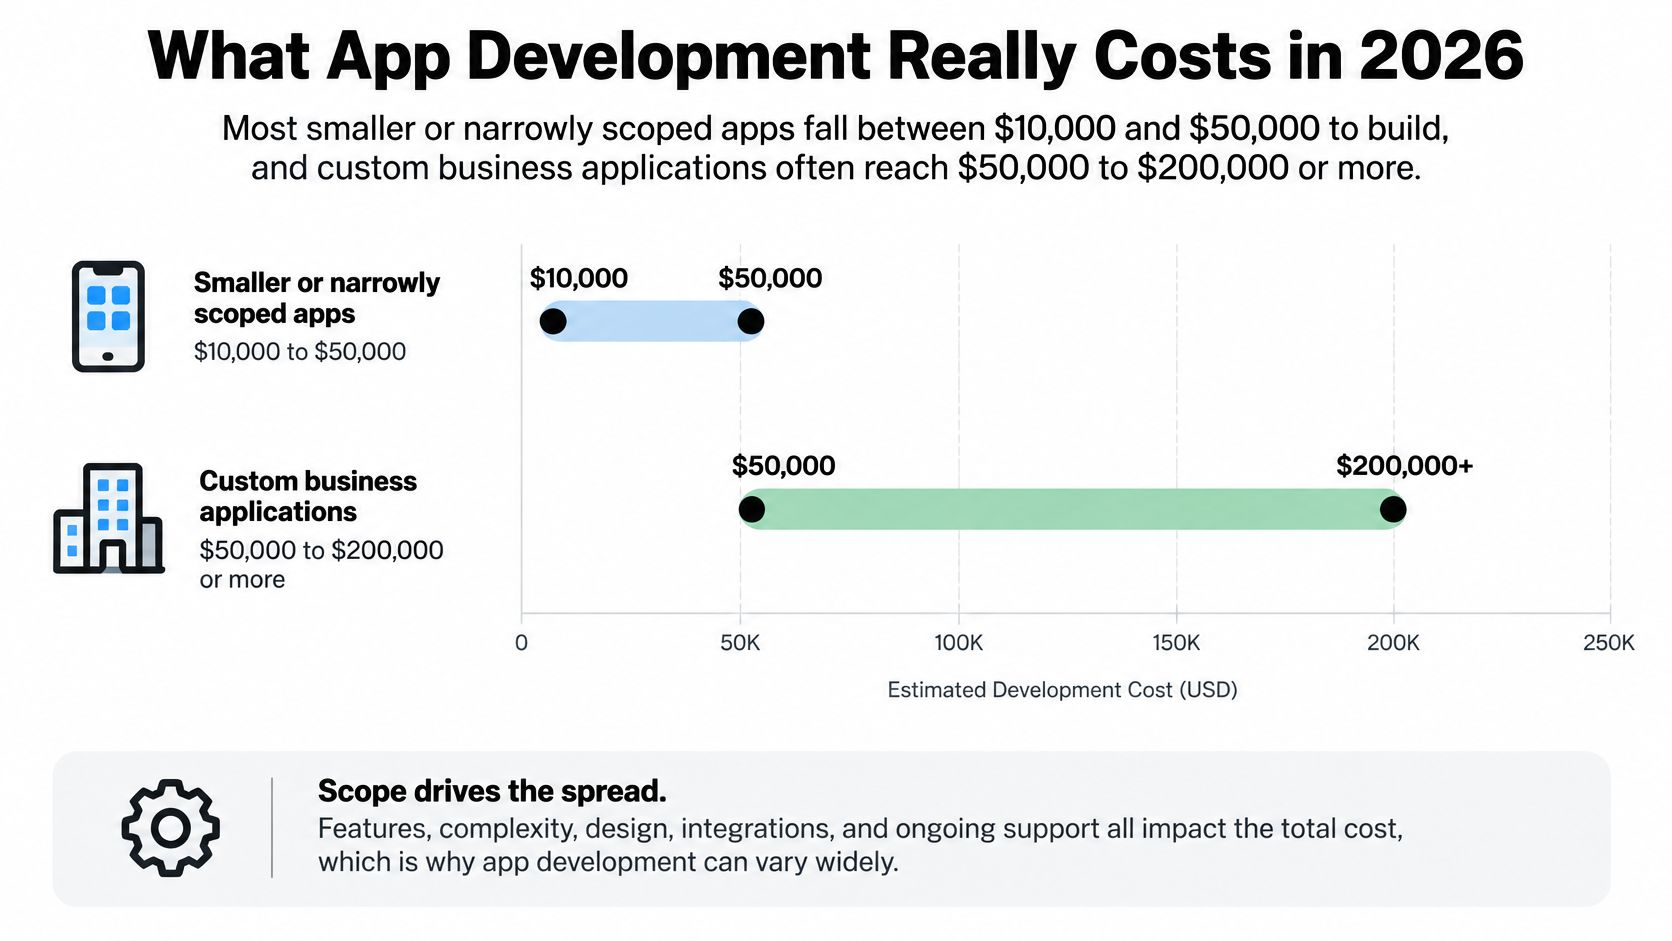
Most smaller or narrowly scoped apps cost about $10,000 to $50,000 to build. Custom business applications often reach $50,000 to $200,000 or more.
That spread exists because the word app covers products that share a name and almost nothing else. A two-screen booking form and a payments dashboard serving three user roles are both called apps, and one average quoted across both tells you nothing you can budget against. The figure that decides whether a build is affordable isn't the invoice at launch anyway. It's the launch invoice plus every release, security patch and platform change that follows over the next 12 to 36 months, which is exactly where a cheap project turns expensive.
Table of Contents
- What App Development Really Costs in 2026
- Why the Same App Can Cost Twice as Much
- Where the Budget Goes Inside a Build
- How to Estimate Your Budget Feature by Feature
- Ongoing Maintenance and Total Cost of Ownership
- Ways to Manage Costs Without Cutting Quality
- Confirm Your Budget Before You Commit to a Build
What App Development Really Costs in 2026
Clutch's data on professional mobile app development firms places the majority of projects in the $10,000 to $49,999 range, with listed agencies commonly charging $25 to $49 per hour, while its U.S. developer-market figures put the average project at roughly $50,000 to $199,999 (Clutch's analysis of app cost drivers). Those two benchmarks sit in the same body of data and pull in opposite directions: the typical small engagement and the typical custom business system are an order of magnitude apart.
Scope explains the gap. Clutch's expert analysis names platform count, feature complexity, number of screens, business logic, integrations and required development effort as the principal cost drivers, and its interviewed specialists estimated that complexity alone can represent 60% to 80% or more of an app's total cost. A single-platform prototype and a production-grade multi-platform product aren't comparable purchases, even though both get filed under mobile apps.
Scope is the budget. The four tiers below translate a feature list into engineering hours and money, with offshore and US/UK figures wherever the benchmarks separate the two.
| Scope | Typical engineering hours | Typical budget range |
|---|---|---|
| Simple MVP | 450–650 | $15,000–$40,000 offshore; $60,000–$120,000 US/UK |
| Basic app with 5–10 screens, authentication and 1–2 integrations | 400–800 | $25,000–$60,000 |
| Mid-complexity cross-platform app | 900–1,300 | $40,000–$80,000 offshore; $120,000–$220,000 US/UK |
| Complex app with real-time, AI/ML or compliance needs | 1,800–3,000 | $80,000–$200,000 offshore; $250,000–$450,000 US/UK |
Read the table from the middle outward. A basic app with 5 to 10 screens, authentication, user profiles and one or two integrations is the tier most small businesses need first, and it lands at roughly $25,000 to $60,000 in blended rates. The MVP row above it is cheaper because it strips out business logic and integrations, not because a cleverer team quoted it. The two rows below are where real-time features, multi-role permissions and compliance work take over the price.
For a second opinion on how those tiers shift for a startup releasing a narrower first version, Continuum Solutions' app pricing guide for startups walks through the same trade-offs from the agency side of the table.
Find the tier closest to your feature list first. Then judge which way your project will move inside that tier before you request a single quote.
Why the Same App Can Cost Twice as Much
A $10,000 build and a $100,000 build are both, on paper, a small-business mobile app. In Clutch's survey of 158 U.S. small-business owners and managers, 33% spent $10,000 or less, 20% spent $10,001 to $30,000, 14% spent $30,001 to $50,000, 16% spent $50,001 to $100,000 and another 16% spent more than $100,000 (Clutch's mobile app developer directory). That puts 32% above $50,000 and 50% inside the $10,001 to $100,000 band, with the published shares rounding to 99%.
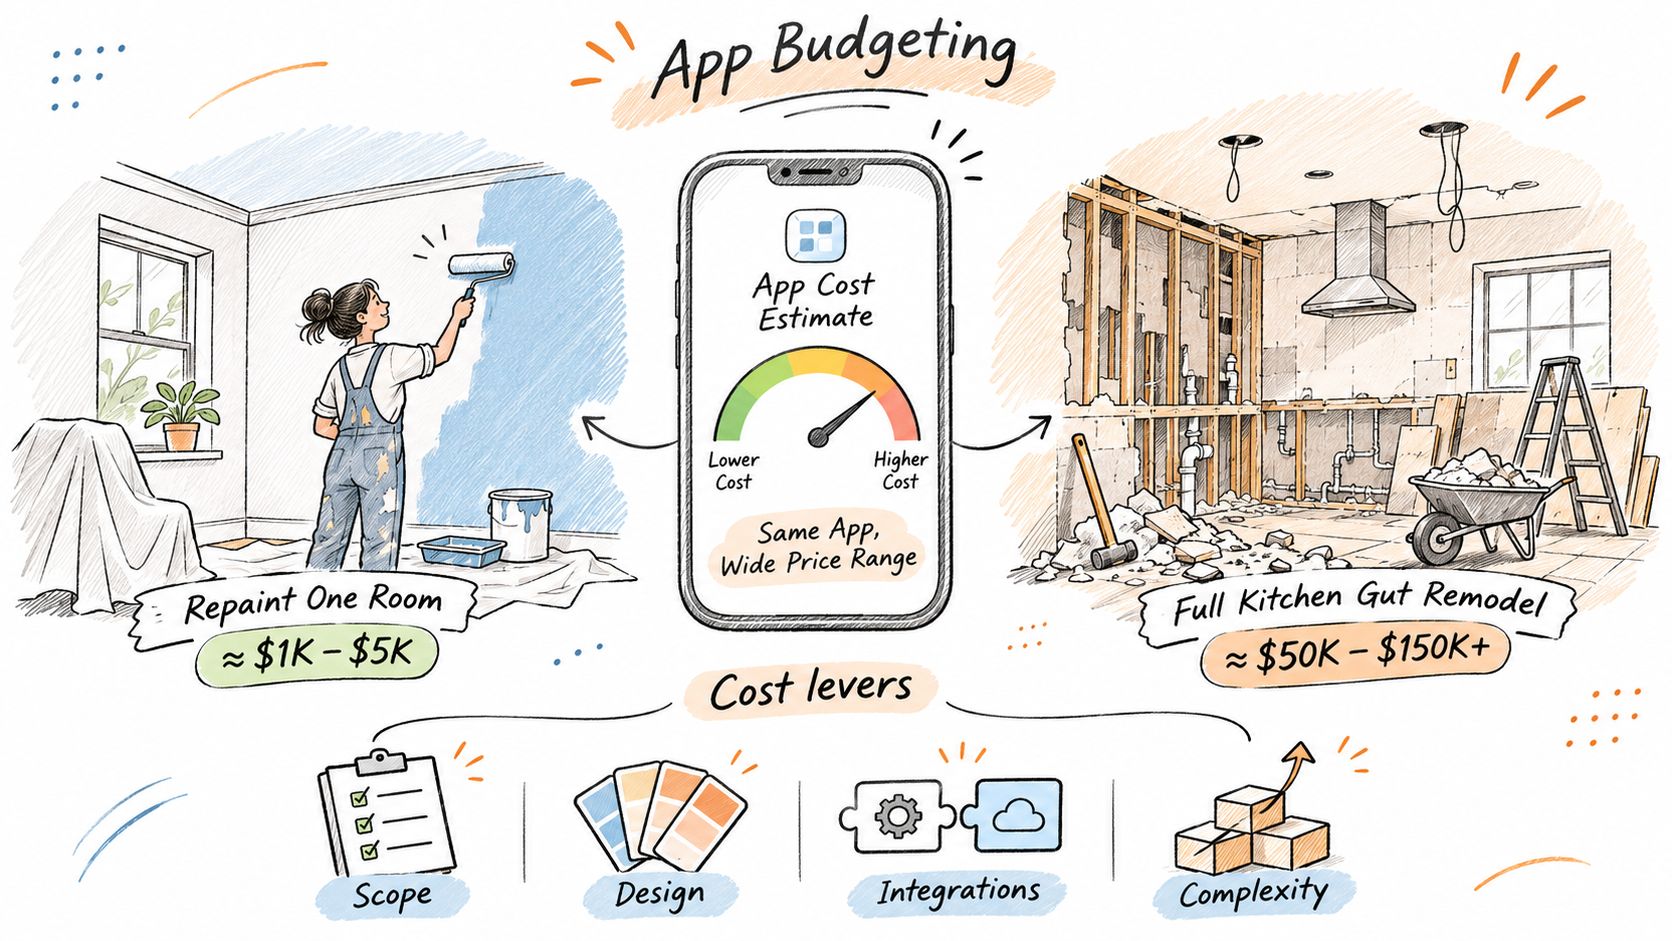
The gap between those bands is scope, and it matters beyond the invoice. The same levers that move a build quote keep charging after launch, so the upfront figure is best read as the first line of a 12 to 36 month ownership cost.
What pushes a project up a tier
Platform count is the first lever. Two native codebases mean a second build, a second test cycle and a second release schedule, and every later update ships twice as well. One cross-platform codebase with shared backend logic is usually the largest structural saving available.
Screens and business logic are the second, and the most misread. A catalog app with 40 static screens can cost less than a four-screen approvals tool, because the approvals tool carries role-based permissions, pricing rules and audit history. Each of those is logic that has to be written, tested and maintained for as long as the app exists, so a low screen count can hide an expensive rules engine.
Integrations multiply the work rather than add to it. Every payment processor, CRM, identity provider or warehouse system brings setup, error handling and testing, plus an upkeep obligation that runs for the life of the dependency. Two integrations are a project. Nine are an architecture, and you pay for it twice, once to build and again to keep it working.
Delivery model catches buyers out. Clutch also reported that costs tend to rise when companies build in-house rather than outsource, which surprises teams who assume cutting the agency out saves money. Payroll, hiring time, tooling and management overhead move onto your books instead, and unlike a fixed build quote, they recur every month the team exists.
The regional spread
Same scope, different band, depending on where the team sits. The same Clutch survey found the pattern holds geographically.
| Region | Share spending over $50,000 |
|---|---|
| Northeast | 46% |
| West | 33% |
| Midwest | 31% |
| South | 25% |
A business in the Northeast was nearly twice as likely to cross $50,000 as one in the South. That gap tracks labor-market pricing rather than build quality, and it explains why a quote from one region can look reckless next to a quote from another for identical work.
For a parallel breakdown of the same cost levers written from the web-app side, Magnitude Marketing's custom app pricing guide is a useful cross-check. Then return to your own scope. A lean app can sit in the cheapest survey band while a substantial share of business projects lands in the top ones, so work out which levers your build pulls before comparing two quotes. Otherwise you are comparing two different products, and the cheaper quote today can still produce the more expensive app by year three.
Where the Budget Goes Inside a Build
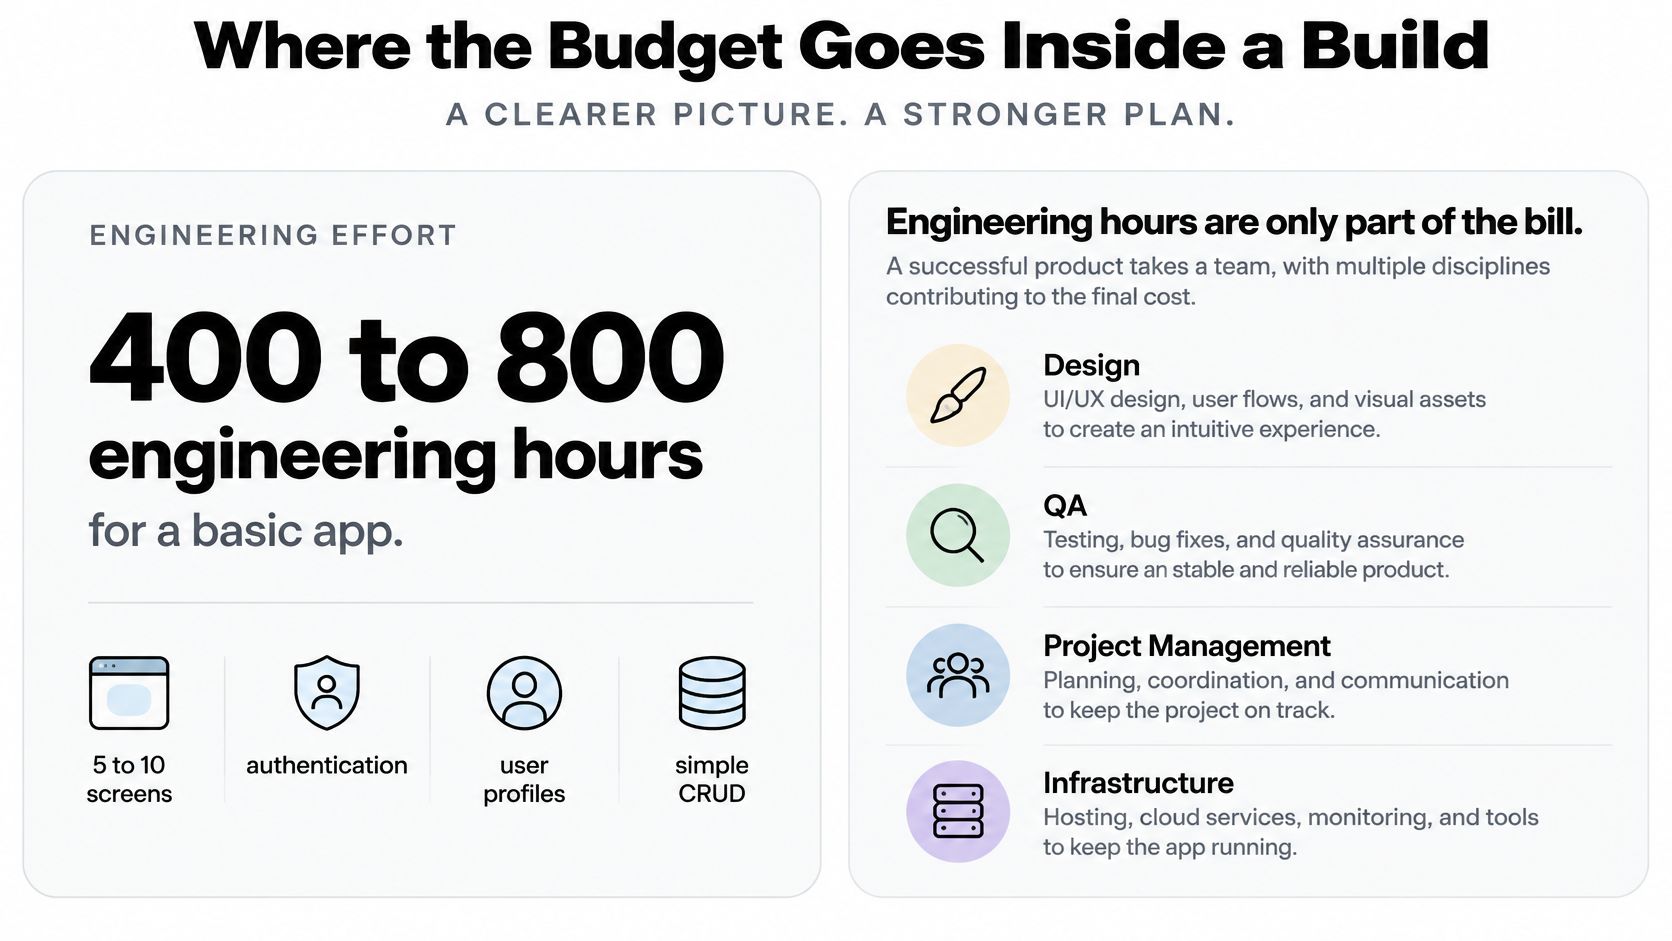
The build quote is the first line of a 12 to 36 month cost model, not the whole bill. A basic app with 5 to 10 screens, authentication, user profiles, simple CRUD operations and one or two integrations typically takes 400 to 800 engineering hours and commonly produces a total budget of about $25,000 to $60,000 at published blended rates (Litslink's breakdown of mobile app development cost). Engineering is the largest line, and the smaller lines decide how expensive the app becomes after launch.
| Cost category | Share of total bill | What it covers |
|---|---|---|
| Engineering | about 63% | building screens, business logic, APIs and integrations |
| Design | about 12% | UX research, screen flows and visual design |
| Quality assurance | about 12% | testing, bug fixing and device coverage |
| Project management | about 5% | planning, coordination and release management |
| Security review, deployment and contingency | about 8% | release checks, hardening, rollout fixes and buffer |
Design is the category buyers delete first and regret most, because a screen flow that gets redesigned after build costs engineering hours to rebuild. QA pays for device coverage, regression testing and bug fixing, and it is the line that prevents a launch-week emergency. Project management at roughly 5% pays for the coordination that keeps your requirements from being reinterpreted by whoever picks up the ticket.
Budget rule: engineering effort is the only line item an AI-assisted workflow can meaningfully compress. Design, testing and release work still need a named owner and a slot in the calendar.
Platform choice then multiplies the total. Separate native iOS and Android codebases usually cost more than one cross-platform implementation, which makes shared architecture and reusable backend logic a budgeting decision rather than an engineering preference.
AI changes the shape of this budget, not its categories. Codebase-aware generation can take hours out of CRUD screens, authentication flows, API wiring and iterative debugging, but any quote you approve should still carry explicit capacity for QA, security review and deployment validation. Cut those lines and the build looks cheaper in month one; the same work returns as incident response, emergency releases and rewrite risk across months 12 to 36.
How to Estimate Your Budget Feature by Feature
Counting screens produces bad estimates, because a screen is a unit of display and cost is a unit of logic. Estimate by feature system instead: identity and access, data model, integrations, deployment, and the nonfunctional controls that keep the thing running. Published benchmarks map those systems onto hours and money (Decipherzone's app development cost benchmark).
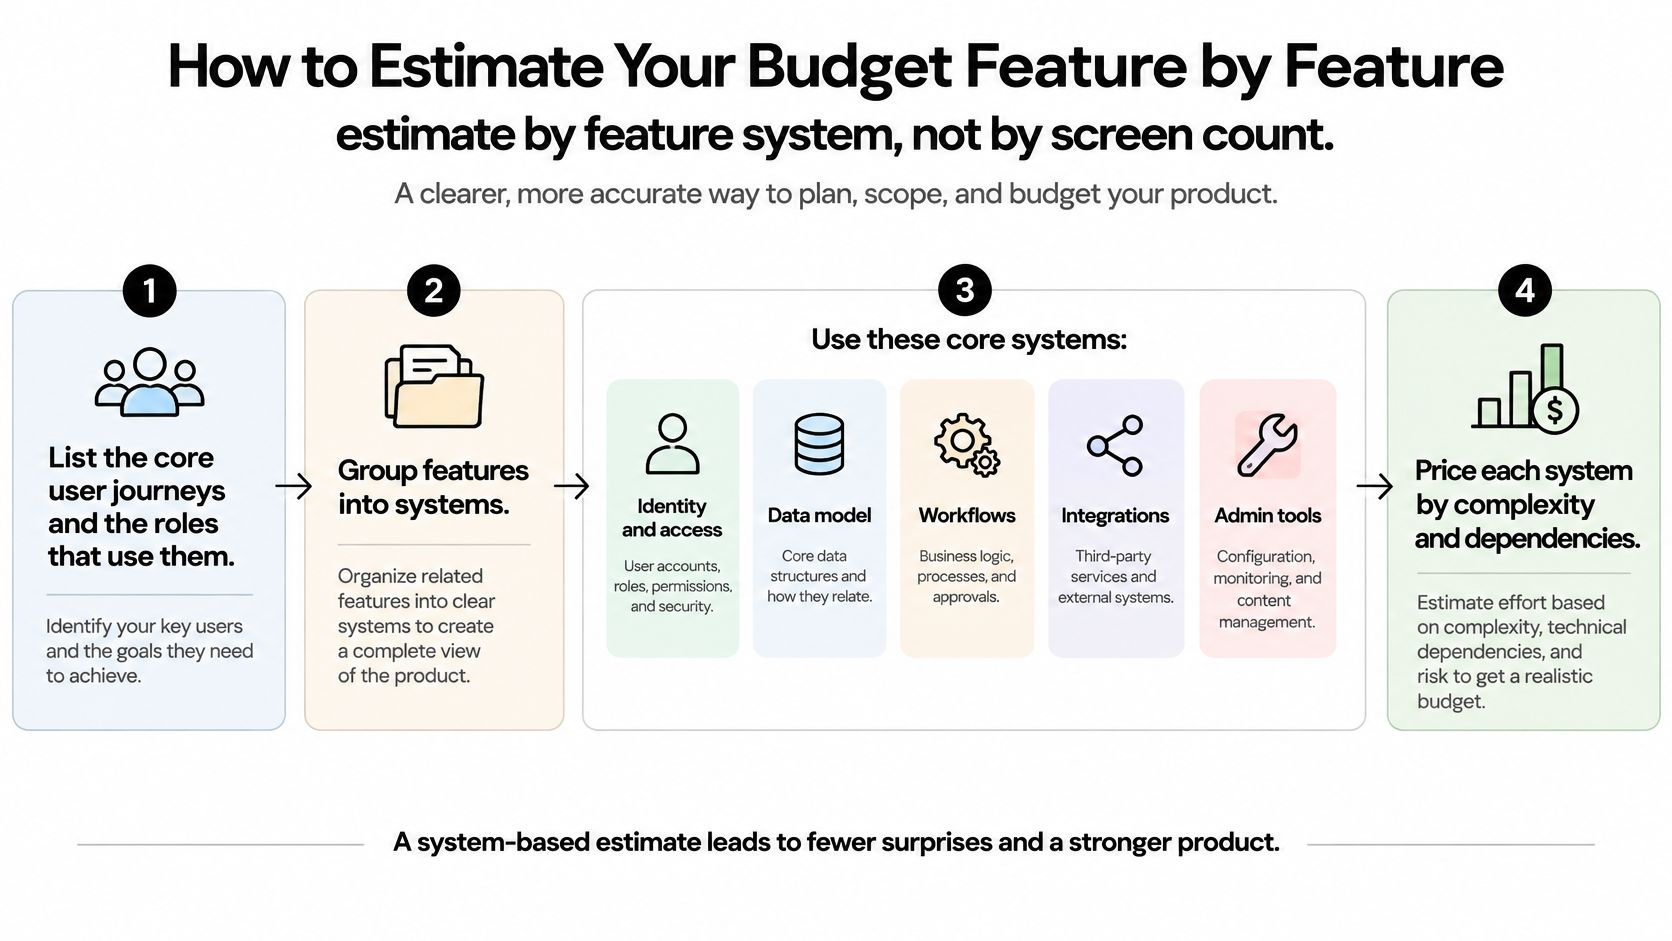
- List the journeys and the roles. Write down each end-to-end task a user performs, and who performs it. Roles create permissions, and permissions are what inflate an otherwise simple app.
- Group features into systems. Identity and access, data model, workflows, integrations, admin tools, deployment, and controls such as observability, data protection and security.
- Tag each system simple, mid-level or complex. Anchor the tags on published hour bands: roughly 450 to 650 hours for a simple MVP, 900 to 1,300 hours for a mid-complexity cross-platform app, and 1,800 to 3,000 hours for real-time functionality, AI/ML, custom backend services, compliance or advanced security.
- Convert hours at your own rate. Offshore benchmarks sit near $15,000 to $40,000 for an MVP, $40,000 to $80,000 for mid-level and $80,000 to $200,000 for a complex build, against roughly $60,000 to $120,000, $120,000 to $220,000 and $250,000 to $450,000 in US/UK markets.
- Add the non-build categories. Design, QA, project management and release preparation don't disappear because the estimate started from features rather than screens.
- Reserve contingency. Security review, deployment validation and store submission consume real hours, so give them a line instead of hoping they fit.
Here's how the method runs on a real shape of project. Say the product is a field-service app with login, a three-table data model covering technicians, jobs and photos, and two integrations, one for scheduling and one for payments. Identity plus a modest data model plus two integrations lands in the mid-complexity band, so you start at 900 to 1,300 hours, price those hours at your team's rate, then add design, QA and release work on top. The same scope quoted by an offshore team sits in the $40,000 to $80,000 band and by a US/UK team in the $120,000 to $220,000 band, which is a geography decision rather than a quality verdict.
If the first release is deliberately narrow, MVP development for startups covers how to cut scope without painting the architecture into a corner. The one thing the method can't do is remove judgment: AI-assisted generation cuts repetitive coding from the estimate, while the architecture choice and the risk review that surround it stay human work with human hours attached.
Ongoing Maintenance and Total Cost of Ownership
A build price is a launch price, and treating it as the whole cost is how cheap projects turn expensive. GoodFirms' survey of 267 development companies estimates simple apps at $12,960 to $30,240 and complex apps at $34,560 to $60,480, and reports that maintenance commonly costs about 25% of the original development cost annually (GoodFirms on the cost to develop an app). Treat that figure as a midpoint rather than a fixed rate, since the percentage varies with scope, platform count, integrations and release obligations.
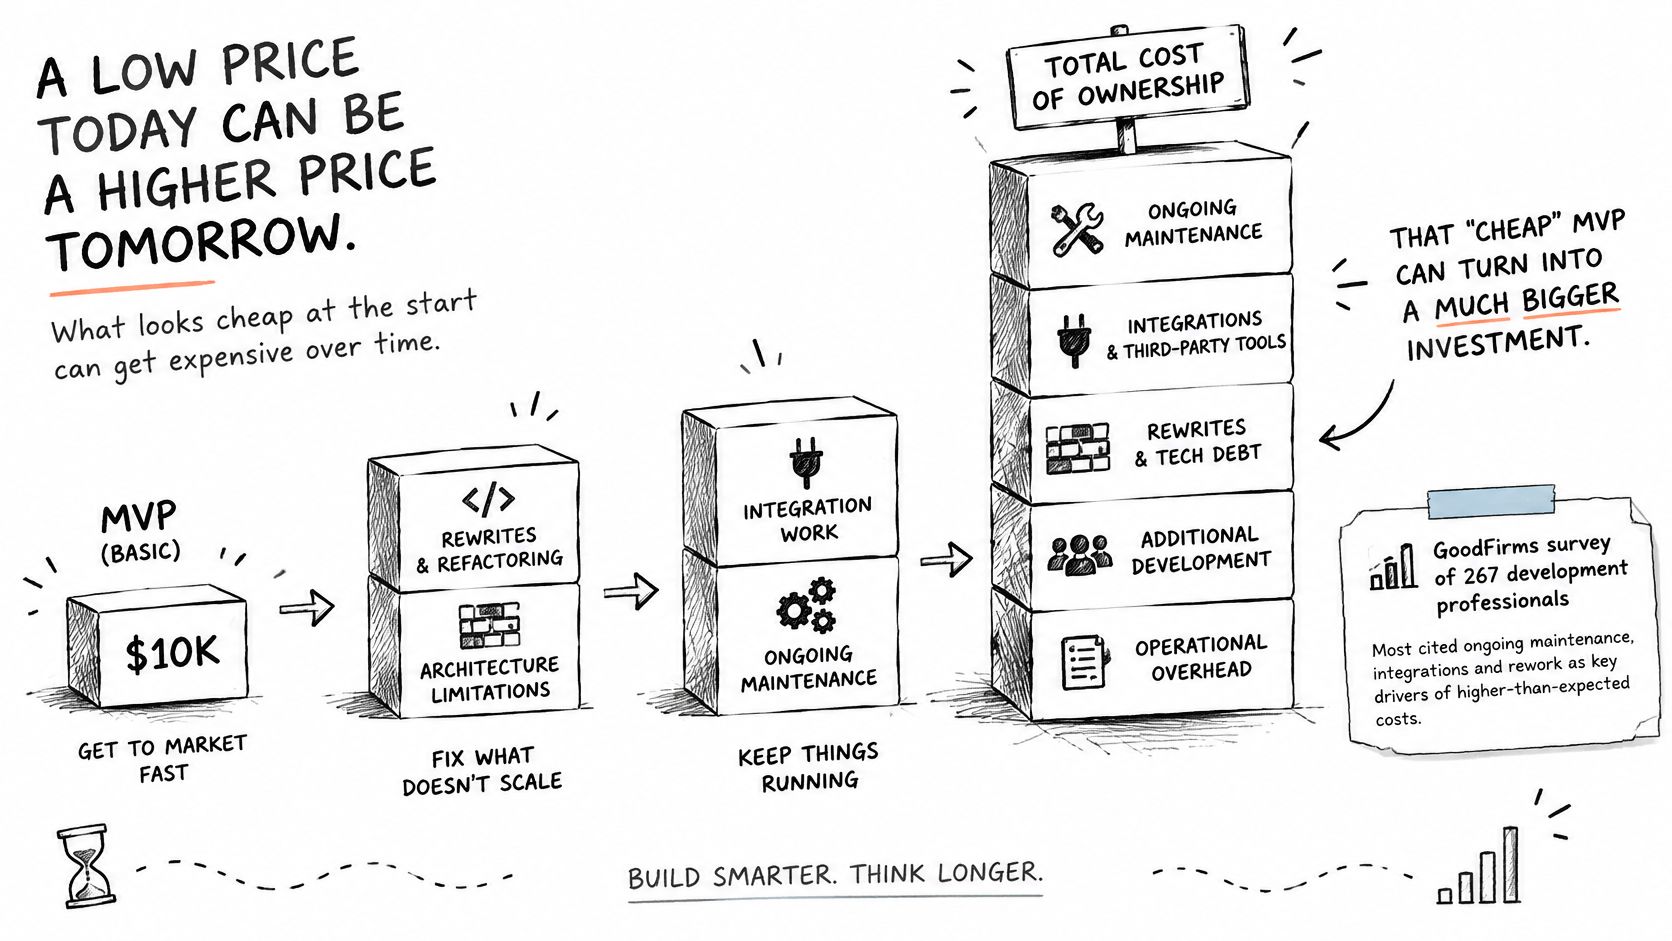
Work the arithmetic. A $30,000 build implies roughly $7,500 per year at that maintenance rate, before infrastructure and third-party service fees. Run the product for three years and total ownership approaches $52,500, a second small project bolted onto the first. That is the stretch most budget conversations skip.
The categories behind that annual figure matter more than the percentage.
| Cost item | Typical basis |
|---|---|
| Maintenance engineering | About 25% of build cost per year |
| Operating-system and API updates | Set by platform changes |
| Security and dependency updates | Ongoing engineering time |
| Hosting and infrastructure | Usage-based and varies by provider |
| Third-party subscriptions | Set by each provider's own terms |
Some of those items are avoidable and some aren't. Managed databases, integrated deployment and reusable components remove a chunk of routine engineering, because backups, migrations, hosting configuration and release plumbing stop being bespoke work. Platform changes, security patching and feature evolution don't go away, since they follow from the app existing and being used. Deployed apps have no age-based expiry on any AppJet plan, so recurring spend tracks the changes you choose and the ones the ecosystem forces rather than a platform aging out.
A cheap MVP built on a tangled data layer generates rewrite costs that no maintenance percentage captures. That is the technical-debt side of ownership, and how to reduce technical debt covers which structural choices keep a codebase cheap to change two years in.
The worksheet that matches how owners really spend looks like this: build cost, plus annual maintenance multiplied by the years you intend to run the product, plus recurring third-party fees. Run it at 12 months, 24 and 36. A vendor that looked markedly cheaper in the first column can lose that lead by the third.
Ways to Manage Costs Without Cutting Quality
Four delivery models price the same scope very differently, and each buys something different with the money.
| Approach | Upfront cost pattern | Main trade-off |
|---|---|---|
| In-house team | Highest fixed payroll | Full control, but slowest to hire and ramp up |
| Offshore agency | Lower hourly rates | Coordination and communication overhead |
| Onshore agency | Highest hourly rates | Faster communication, higher price |
| AI-assisted platform such as AppJet | Free plan at $0 per month, Starter at $5 per month, Pro at $15 per month | Less coordination across coding, database and deployment; architecture and QA still required |
Cheaper hourly rates never mean cheaper coordination. A team eight time zones away still needs someone on your side writing unambiguous requirements and reviewing what comes back, and that overhead lands on your calendar rather than the invoice.
The controls that reduce spend are structural:
- Cut to a launch feature set. List every feature and ask which ones a first user needs on day one. Roles, audit history and offline mode are the three most common premature additions.
- Start with one cross-platform codebase. Two native builds cost more for identical functionality, and the second platform can follow once the first earns revenue.
- Reuse backend logic across platforms. One API serving several clients removes duplicated work and duplicated bugs.
- Tie payments to working milestones. Pay for a deployed, tested slice rather than for elapsed weeks. Milestone billing turns scope arguments into scheduled conversations.
- Fund maintenance from day one. A fixed annual line set at pre-launch beats an emergency budget discovered after the first operating-system update breaks login.
Comparing delivery models properly means comparing total cost, not hourly rates, and agentic development solutions and cost sets out where that model changes the arithmetic and where it doesn't. The honest summary is that AI compresses implementation and leaves review, testing and release work intact.
Confirm Your Budget Before You Commit to a Build
Confirm a defensible range before you sign with a vendor or a platform, because a line item you can explain to a finance lead beats a low quote you have to renegotiate in month three. The checklist takes about an hour.
- Match your features to a tier. Use the tier whose feature list resembles yours, not the tier whose price resembles your savings goal.
- Set the range for your region. Offshore, onshore and in-house teams produce different bands for identical scope.
- Demand an itemized quote. Engineering, design, QA and project management as separate lines, so you can compare shares rather than totals.
- Pin down platform count. Confirm whether iOS and Android are both in scope, and whether that means one codebase or two.
- Carry the maintenance line into the total. A launch number without an annual figure is half a budget.
If a quote lands well below its tier, don't celebrate. Ask which systems are absent: roles, integrations, audit history, deployment, security review. The missing line is usually the one you'll pay for later, at emergency rates and without a schedule you controlled.
If the idea is still unproven, validate it on a low-cost plan before committing a larger budget to a full build. Third-party services connected to a project, such as external hosting or database subscriptions, can carry their own charges and terms, so confirm those before you model a monthly total you'll have to live with.
AppJet builds, edits and deploys full-stack apps from plain-language instructions, with GitHub connectivity, Supabase databases and Cloudflare deployment in one workspace, which removes a good share of the coordination work that pushes projects into the next budget tier. You can start on the Free plan at $0 per month with deployment included and see how far a tightly scoped feature list gets before you commit a larger sum. Visit AppJet to build the first version and price the rest of your roadmap against working output rather than an estimate.